-
Notifications
You must be signed in to change notification settings - Fork 0
5. Post Hoc tests
For the purposes of this document we will continue with the following:
base_model <- MCMmodel(data_summary, n_latent=2, constrained_a=FALSE)
no_A_model <- MCMedit(base_model, "A", "a", 0)

coords <- expand.grid(x=1:5+2, y=1:5+2)[upper.tri(matrix(0, 5, 5), diag=FALSE), ]
unidirectional_model <- MCMedit(base_model, pointer="A", name=list(coords$x, coords$y), value=0)

base_result <- MCMfit(base_model, data_summary, optim_iters=c(500, 25), monitor_grads=TRUE)
no_A_result <- MCMfit(no_A_model, data_summary, optim_iters=c(500, 25), monitor_grads=TRUE)
unid_result <- MCMfit(unidirectional_model, data_summary, optim_iters=c(500, 25), monitor_grads=TRUE)
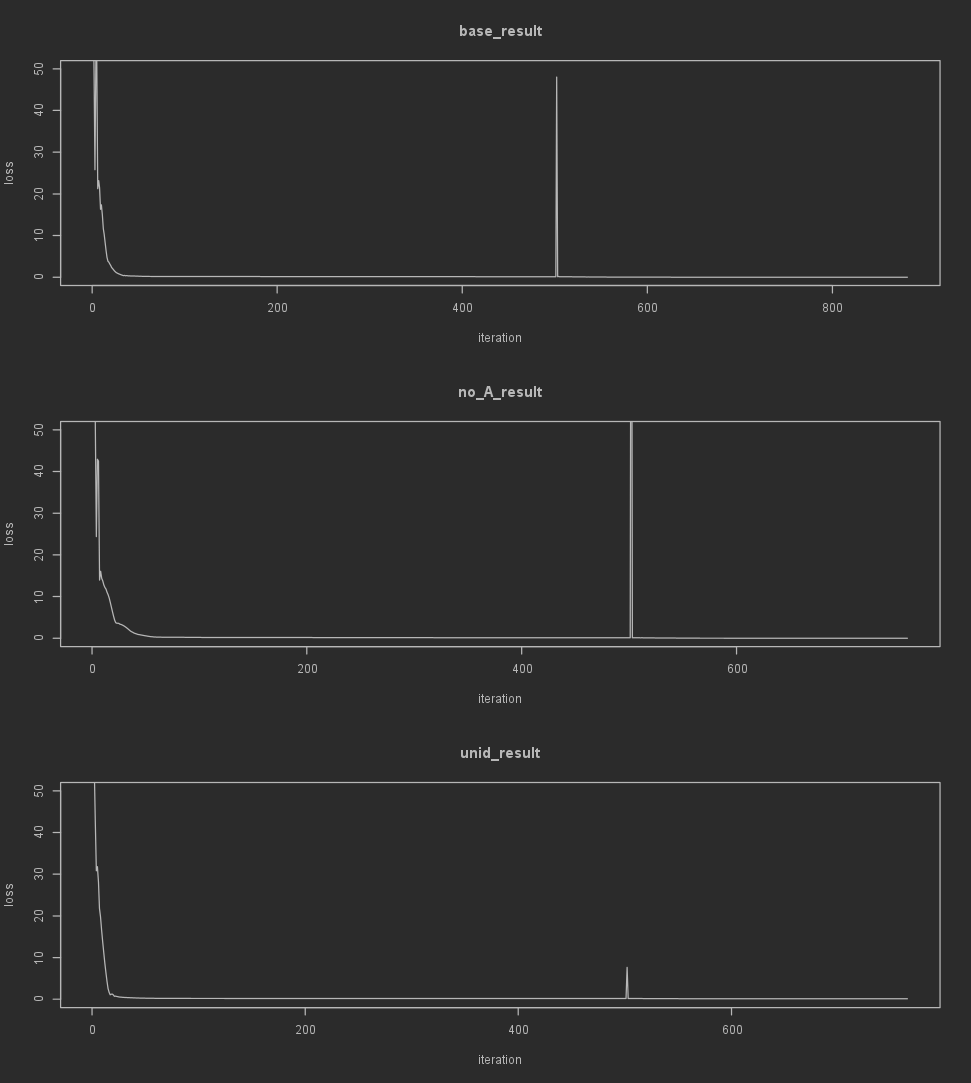
As far as indicators of if the optimization is even working, checking if the loss decreases over iterations is the simplest one. Since the loss history is stored in the MCM result object as a vector, we can do this using the built-in plot() function.
par(mfrow=c(3, 1))
plot(base_result$history$loss, type='l', xlab='iteration', ylab='loss', main='base_result', ylim=c(0, 50))
plot(no_A_result$history$loss, type='l', xlab='iteration', ylab='loss', main='no_A_result', ylim=c(0, 50))
plot(unid_result$history$loss, type='l', xlab='iteration', ylab='loss', main='unid_result', ylim=c(0, 50))

Note that when using different optimizers in sequence (especially with LBFGS) you'll likely see a peak in this graph when the next optimizers is initiated.
Additionally, we can look at the history of the gradients for each parameter. The gradients are included in the MCM result object as a custom class. This is mainly to make plotting and transforming the gradients easier. To obtain the full gradient history as a dataframe, to analyze it manually you can run the following:
base_result_grad_history_df <- as.data.frame(base_result$gradients)
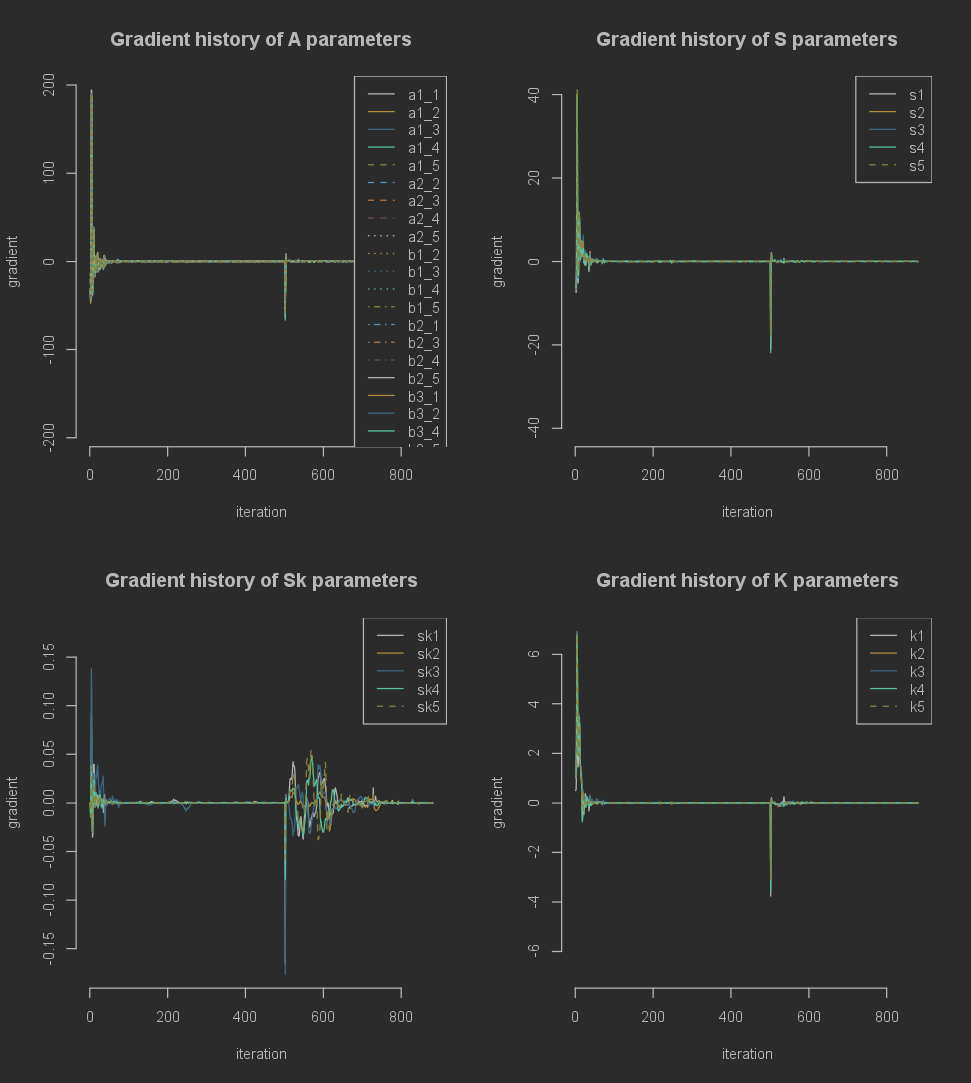
To visualize all gradient histories we can run the following.
plot(base_result$gradients)

This splits the parameters into categories depending on which base matrix (see wiki pages on the MCM model) they originate from. Any additional arguments passed to this plot function will be applied to all subplots.
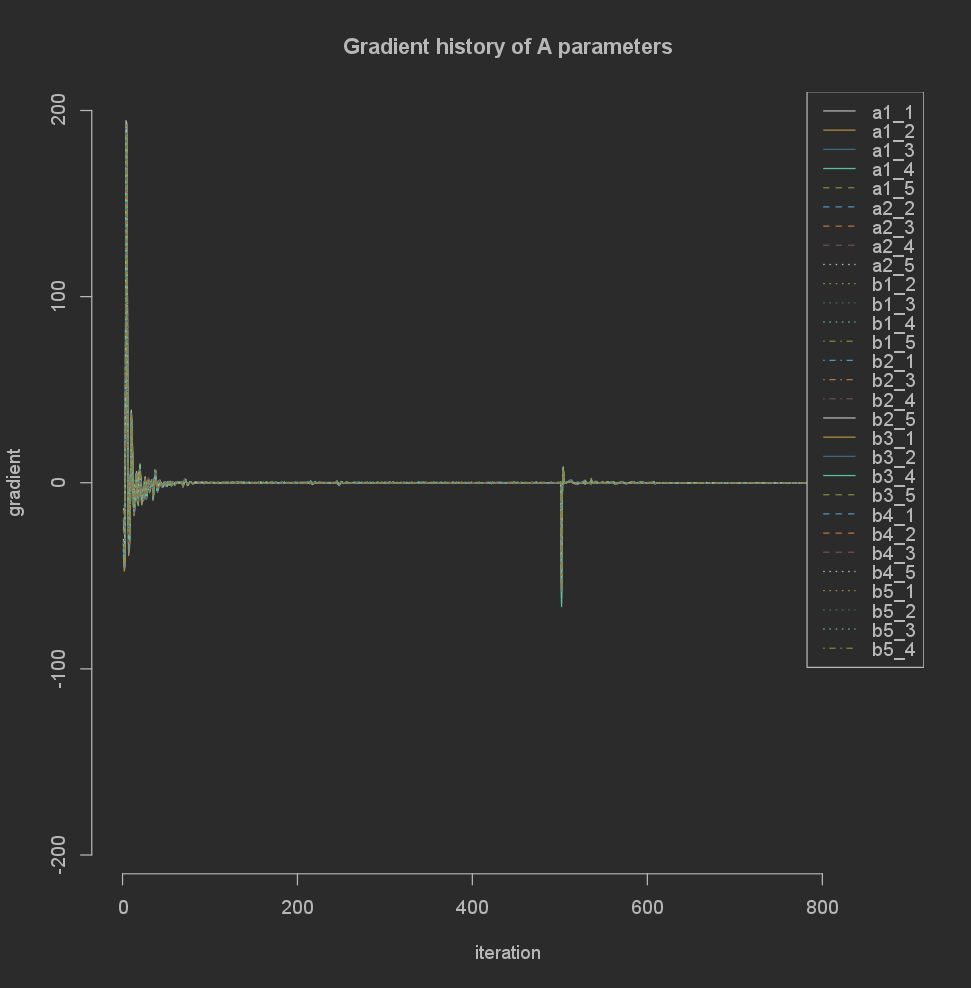
Alternatively you can zoom in on a single matrix.
plot(base_result$gradients$A)

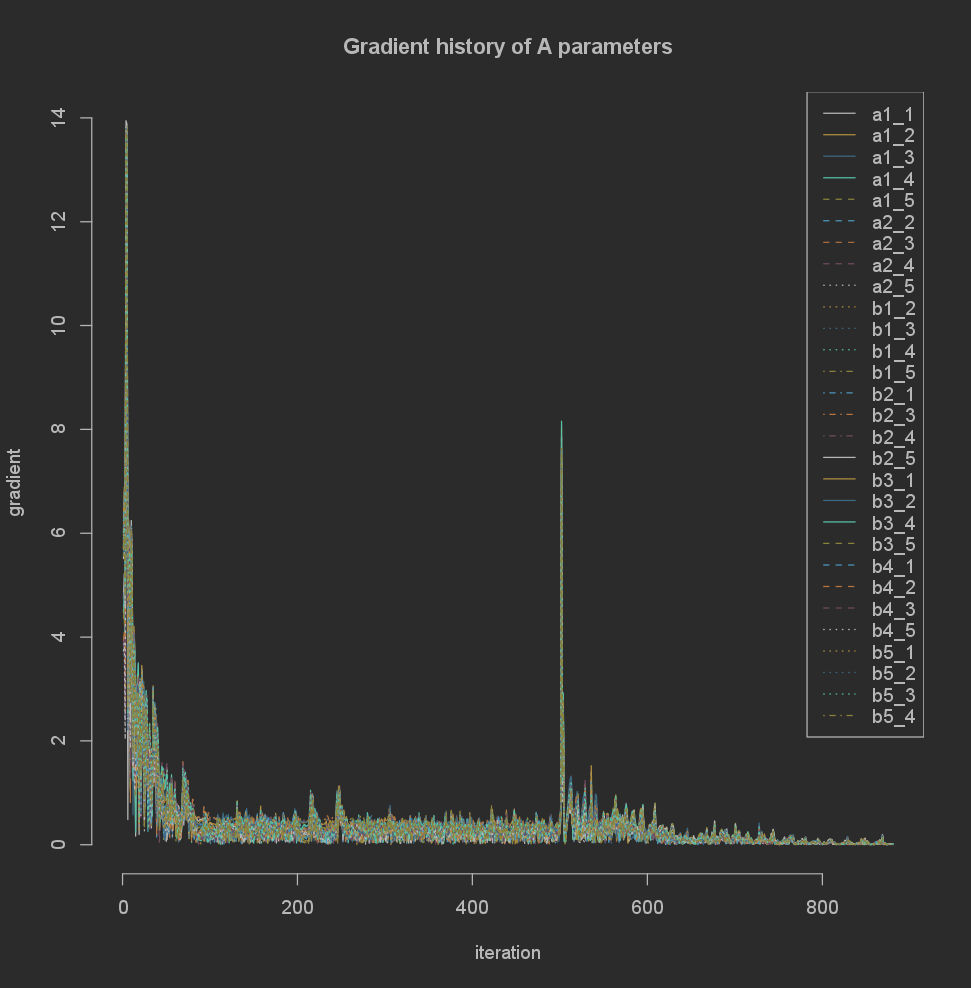
There are several options for scaling built in to the gradient classes, such as log, abs, and sqrt:
plot(sqrt(abs(base_result$gradients$A)))

Finally, there are different summarizing methods for the gradient: min, max and summary. For example:
summary(base_result$gradients)
Will return a dataframe with a detailed summary with minimum, maximum of all values and absolute values, as well as gradient at the last iteration:
                      A.a1_1        A.a1_2        A.a1_3        A.a1_4        A.a1_5        A.a2_2        A.a2_3        A.a2_4        A.a2_5        A.b1_2        A.b1_3        A.b1_4        A.b1_5
min            -5.143213e+01 -4.752067e+01 -4.420788e+01 -5.223549e+01 -4.621045e+01 -3.466873e+01 -3.283141e+01 -3.769374e+01 -3.238495e+01 -5.587294e+01 -5.091473e+01 -6.167405e+01 -5.389321e+01
max             7.585236e+01  1.124280e+02  1.104663e+02  1.113398e+02  1.149420e+02  1.003268e+02  9.872623e+01  9.929739e+01  1.020223e+02  1.412878e+02  1.383869e+02  1.388800e+02  1.453401e+02
min(abs)        5.621114e-06  1.659617e-06  1.322373e-05  1.165841e-06  5.611684e-06  1.711422e-06  4.531583e-06  1.022825e-05  1.128111e-05  9.220093e-07  1.654774e-05  2.295338e-05  1.657475e-05
max(abs)        7.585236e+01  1.124280e+02  1.104663e+02  1.113398e+02  1.149420e+02  1.003268e+02  9.872623e+01  9.929739e+01  1.020223e+02  1.412878e+02  1.383869e+02  1.388800e+02  1.453401e+02
last iteration -1.108114e-04 -1.287877e-04 -1.134933e-04 -1.587445e-04 -2.443558e-04 -6.612344e-05 -3.770762e-05 -1.013982e-04 -6.455206e-05 -2.995590e-04 -2.861554e-04 -3.193808e-04 -4.322873e-04
                      A.b2_1        A.b2_3        A.b2_4        A.b2_5        A.b3_1        A.b3_2        A.b3_4        A.b3_5        A.b4_1        A.b4_2        A.b4_3        A.b4_5        A.b5_1
min            -6.176170e+01 -5.437886e+01 -6.540476e+01 -5.780648e+01 -6.431362e+01 -6.057674e+01 -6.656063e+01 -5.829870e+01 -5.806892e+01 -5.388167e+01 -5.221352e+01 -5.407223e+01 -5.598459e+01
max             1.210252e+02  1.862775e+02  1.877108e+02  1.945052e+02  1.200645e+02  1.887515e+02  1.855341e+02  1.925772e+02  1.185707e+02  1.872007e+02  1.829224e+02  1.912507e+02  1.222052e+02
min(abs)        2.282555e-06  7.185154e-06  5.502952e-06  1.378357e-07  1.078937e-05  1.328066e-06  5.343370e-05  1.764297e-05  2.306886e-06  4.621223e-06  1.463736e-05  1.746509e-05  8.797739e-06
max(abs)        1.210252e+02  1.862775e+02  1.877108e+02  1.945052e+02  1.200645e+02  1.887515e+02  1.855341e+02  1.925772e+02  1.185707e+02  1.872007e+02  1.829224e+02  1.912507e+02  1.222052e+02
last iteration -2.667808e-04 -2.801595e-04 -3.738813e-04 -4.841434e-04 -3.154050e-04 -3.559701e-04 -3.840011e-04 -4.847776e-04 -2.578460e-04 -3.270321e-04 -2.933447e-04 -4.476309e-04 -2.627824e-04
                      A.b5_2        A.b5_3        A.b5_4          S.s1          S.s2          S.s3          S.s4          S.s5        Sk.sk1        Sk.sk2        Sk.sk3        Sk.sk4        Sk.sk5
min            -5.305309e+01 -5.121470e+01 -5.828861e+01 -2.115492e+01 -1.994950e+01 -1.962381e+01 -2.188124e+01 -1.790882e+01 -1.652053e-01 -2.363268e-02 -1.765271e-01 -7.858545e-02 -5.690962e-02
max             1.905715e+02  1.865612e+02  1.879217e+02  2.245840e+01  4.006755e+01  3.923344e+01  3.959208e+01  4.115178e+01  9.197994e-02  2.892910e-02  1.378856e-01  4.837161e-02  5.425204e-02
min(abs)        1.340220e-05  1.281477e-05  3.486872e-06  1.545064e-06  1.387671e-07  7.711351e-07  2.146699e-07  2.179295e-06  0.000000e+00  0.000000e+00  0.000000e+00  0.000000e+00  0.000000e+00
max(abs)        1.905715e+02  1.865612e+02  1.879217e+02  2.245840e+01  4.006755e+01  3.923344e+01  3.959208e+01  4.115178e+01  1.652053e-01  2.892910e-02  1.765271e-01  7.858545e-02  5.690962e-02
last iteration -3.279084e-04 -3.006561e-04 -3.196449e-04 -6.734114e-05 -9.906944e-05 -7.002614e-05 -8.970825e-05 -1.141196e-04  9.421608e-06 -2.770525e-06 -8.193325e-06  1.694891e-06  1.165568e-05
                        K.k1          K.k2          K.k3          K.k4          K.k5
min            -3.764635e+00 -3.166836e+00 -3.313023e+00 -3.622292e+00 -3.098831e+00
max             4.212971e+00  6.899916e+00  6.926666e+00  6.746869e+00  6.816867e+00
min(abs)        1.102453e-07  4.834263e-06  5.845213e-07  5.410402e-07  4.575806e-06
max(abs)        4.212971e+00  6.899916e+00  6.926666e+00  6.746869e+00  6.816867e+00
last iteration  1.102453e-07 -4.247428e-05 -2.113427e-05  3.863533e-06  1.728674e-05
Finally, when you have fitted different models, you can compare their performance in terms of loss calculated from a dataset (ideally a seperate holdout dataset) using the MCMcompareloss() function.
The input to this function should be a list of MCM result objects (names of the list will be used as rownames in the output), and the MCM data summary of the holdout sample:
MCMcompareloss(list(Base=base_result, NoA=no_A_result, Unidir=unid_result), holdout_summary)
This will return a dataframe detailing the loss, chisq and bic in both the training dataset and the holdout (test) dataset, as well as the difference in loss, and the number of parameters of each model
       mse_train_loss train_chisq train_bic mse_test_loss      mse_diff mse_test_chisq mse_test_bic N_parameters
Base      0.002169265    54.23164  499.8034     0.3136756            NA       3136.756     3542.011           44
NoA       0.003176718    79.41796  433.8500     0.3139555 -0.0002798736       3139.555     3461.917           35
Unidir    0.118693106  2967.32765 3311.6331     0.4421709 -0.1284953058       4421.709     4734.861           34
For more extensive information about the models and results you can include extensive_model_info=TRUE
MCMcompareloss(list(Base=base_result, NoA=no_A_result, Unidir=unid_result), holdout_summary, extensive_model_info=TRUE)
Which will return the following
       mse_train_loss train_chisq train_bic mse_test_loss      mse_diff mse_test_chisq mse_test_bic N_parameters loss_type use_skewness use_kurtosis optim1 optim1_iters optim1_lr
Base      0.002169265    54.23164  499.8034     0.3136756            NA       3136.756     3542.011           44       mse         TRUE         TRUE  rprop          500      0.02
NoA       0.003176718    79.41796  433.8500     0.3139555 -0.0002798736       3139.555     3461.917           35       mse         TRUE         TRUE  rprop          500      0.02
Unidir    0.118693106  2967.32765 3311.6331     0.4421709 -0.1284953058       4421.709     4734.861           34       mse         TRUE         TRUE  rprop          500      0.02
        optim2 optim2_iters optim2_lr train_n version use_bounds compute_se    se_type device low_memory Preparation_runtime Optimizer_runtime SE_runtime Total_runtime
Base     lbfgs           25         1   25000  0.25.0       TRUE       TRUE asymptotic    cpu      FALSE          0.05799985           42.4485  0.3590002       42.8655
NoA      lbfgs           25         1   25000  0.25.0       TRUE       TRUE asymptotic    cpu      FALSE          0.26200008           33.7770  0.3314979       34.3705
Unidir   lbfgs           25         1   25000  0.25.0       TRUE       TRUE asymptotic    cpu      FALSE          0.05549908           35.2225  0.2410011       35.5190